Dive deeper into this year’s survey results.

Finance leaders chart a course for progress despite cross-currents
Between March 19 and April 14, 2026, U.S. Bank surveyed 1,000 senior finance leaders at firms whose annual revenue ranged from $100 million to more than $5 billion. The results reveal an appetite for growth against a backdrop of geopolitical tension, inflation and cost pressure.
More Resources
Previous reports
Optimism cools amid rising uncertainty
In spring 2026, CFOs and other senior finance leaders at U.S. firms reported feeling less optimistic about the economy and their businesses since our mid-2024 survey.
Finance leaders’ outlooks for the economy and their business’s financial prospects
36% have a positive 12-month outlook on the U.S. economy, down from 42% in mid-2024
58% have a positive 3-year outlook on the U.S. economy, down from 63% in mid-2024
45% have a positive 12-month outlook on their business’s financial prospects, down from 52% in mid-2024
64% have a positive 3-year outlook on their business’s financial prospects, down slightly from 66% in mid-2024
Cost savings the focus, but growth back in the picture
Respondents’ priorities and concerns have changed since our last CFO Insights survey in mid-2024. Growth priorities like driving revenue and digital transformation have risen up the list. As to risks, geopolitical tension, war and inflation are top of mind.

39% identify cutting costs and driving efficiencies as a top priority, up from 33% in mid-2024.

Driving revenue growth is now the #2 ranked priority at 31%, up from #7 in mid-2024.

30% cite digital transformation as one of the finance function’s top three priorities for the next year.
M&A momentum and supply chain action indicate the desire for growth and cost savings

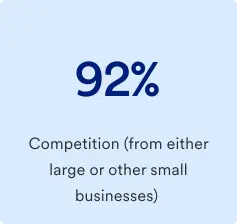
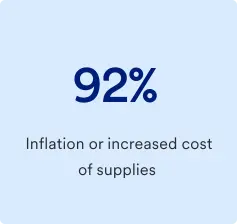
Mounting global shocks stoke inflation pressures
Measuring AI ROI is a challenge
Larger firms are more likely to measure and generate positive ROI
Following implementation, for what proportion of AI investments have you measured the ROI in the past 12 months? (Mean score)
Of AI investments where ROI was measured, how many generated a positive ROI? (Mean score)
Digital transformation brings rich data rewards but heightens fraud risk
Malicious actors are using AI and deepfakes to carry out scams more effectively, frequently, and on a greater scale than ever before. The Federal Trade Commission found that consumers lost $12.5 billion to fraud in 2024, a 25% increase on the previous year. Against this backdrop, the most common risk-mitigation focus (57%) over the past 12 months has been reducing fraud and cyber risk in payments operations. Finance leaders in higher education, investment management and commercial real estate are the most likely to have modernized payments in this way.
Fraud, cyber risk and data drove payments modernization last year

Read the report and connect with us
Find out how the finance function is mastering the balance of offense and defense by focusing on cost control, risk mitigation, digital transformation and embedded payments.
About the research
The results of this research are based on a survey conducted between March 19 and April 14, 2026, of 1,000 senior finance leaders who work in U.S. businesses across multiple sectors.
Company sizes
Every survey respondent works for an organization that generates at least $100 million in annual revenue. This is the percentage of respondents by annual revenue:
- >$5 billion: 10%
- $2 – $4.99 billion: 20%
- $1 – $1.99 billion: 15%
- $500 – $999 million: 15%
- $250 – $499 million: 17%
- $100 – $249 million: 23%
By obtaining responses from finance leaders across a wide range of sectors, company sizes and job roles, we are able to provide a report that incorporates a wide range of viewpoints.
Job Roles
Stay connected
Previous reports
Start of disclosure content